User Guide
-
The Basics
Information about the basics you need to know to get started with Quoll Writer.
- Getting Started
- The Project Window
- Your Projects Window
- Projects Overview
- Chapters Overview
- Assets Overview (Characters, Locations, etc.)
- Scenes & Plot Outline Items
- Notes
- Tags & Tagging
- The Idea Board
- Warm-ups
- Searching
- Full Screen Mode
- Linking objects together
- Useful keyboard shortcuts
- Choosing a User Interface Language
- Changing the names of objects
- The Options Panel
- Achievements
-
Advanced Topics
Information about more topics such as importing and exporting. Using the Problem Finder or setting an edit position in a Chapter.
-
Editor Mode
Details about using Editor Mode to work with others to get feedback on your work.
Word Counts & Charts
To view the word counts a Chapter has click on the icon in the Chapter toolbar or use the keyboard shortcut Ctrl+W while viewing a Chapter. The following sidebar will be shown:
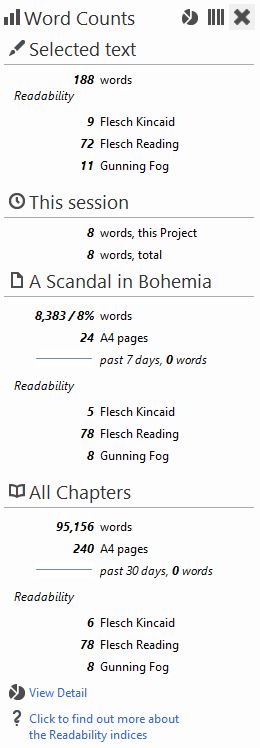
The sidebar is divided into the following sections:
- If some text in the Chapter has been selected then the word count is displayed. If more than 100 words is selected then information about the readability is provided.
- The number of words added/removed in the current session.
- The word count for the Chapter currently being viewed and the number of A4 pages it would fill if printed in the Chapter's current font/font size. A sparkline chart shows the changes that have occurred in the past 7 days. The readability of the Chapter will be displayed when it's word count exceeds 100 words.
- The total word count for all Chapter in the Project and an A4 page count. A sparkline for the past 30 days of activity is also provided. The readability of the Project will be displayed when it's word count exceeds 100 words.
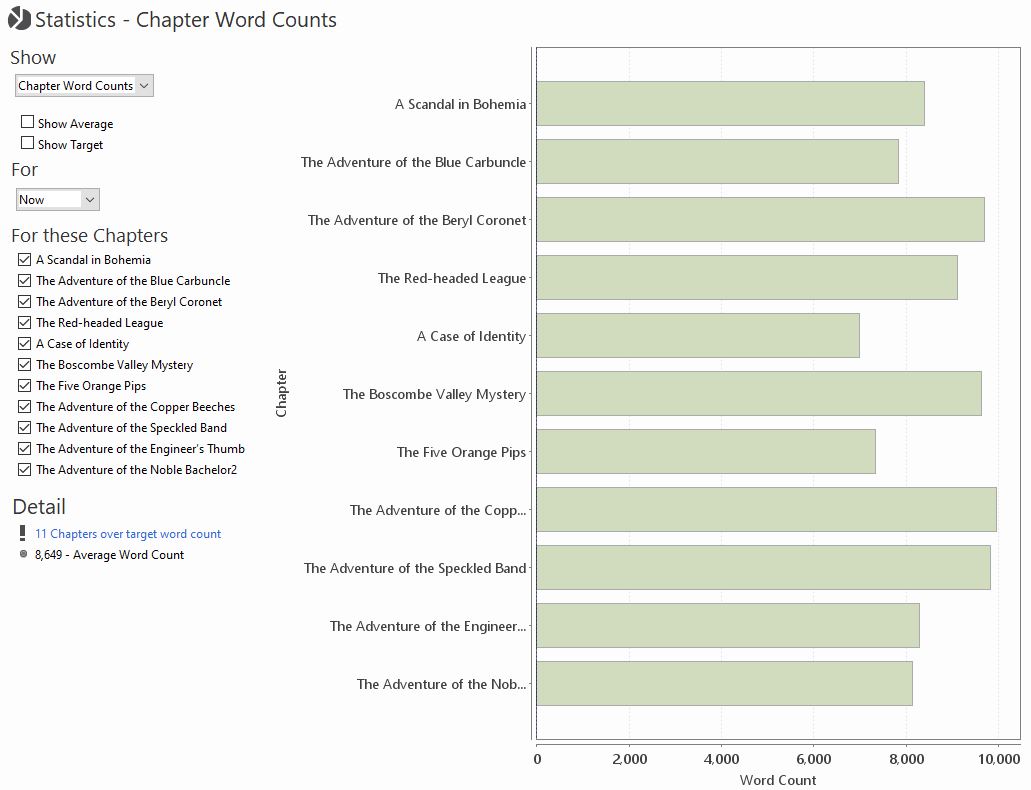
You can also access the word count history by using the View Detail link at the bottom of the sidebar. If clicked on the Chapter Word Counts chart will be displayed:
A number of charts detailing various statistics are available in Quoll Writer.
Charts
A number of charts detailing various statistics are availalbe in Quoll Writer. To access the charts use the Statistics menu item in the menu. To change chart use the Show drop down box in the top left of the chart.
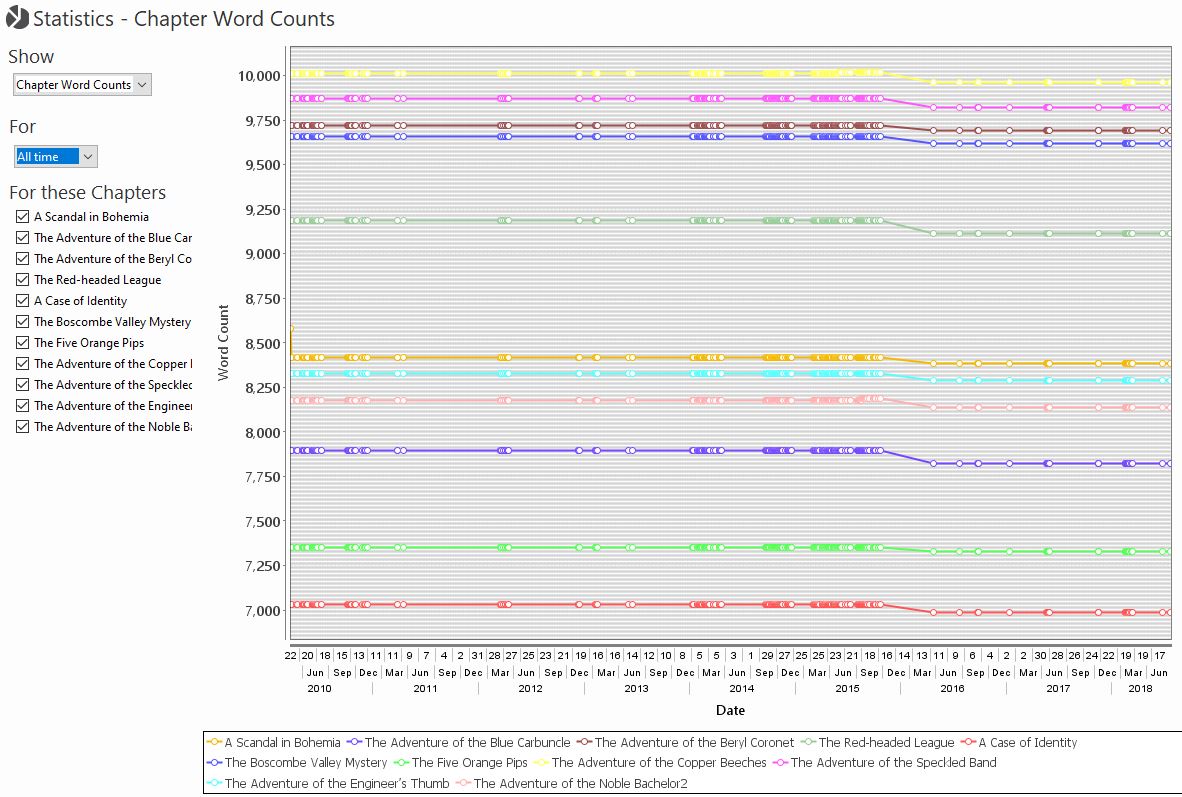
Chapter Word Counts Chart
An example chart, for the current state of the word counts for the Project is shown below:
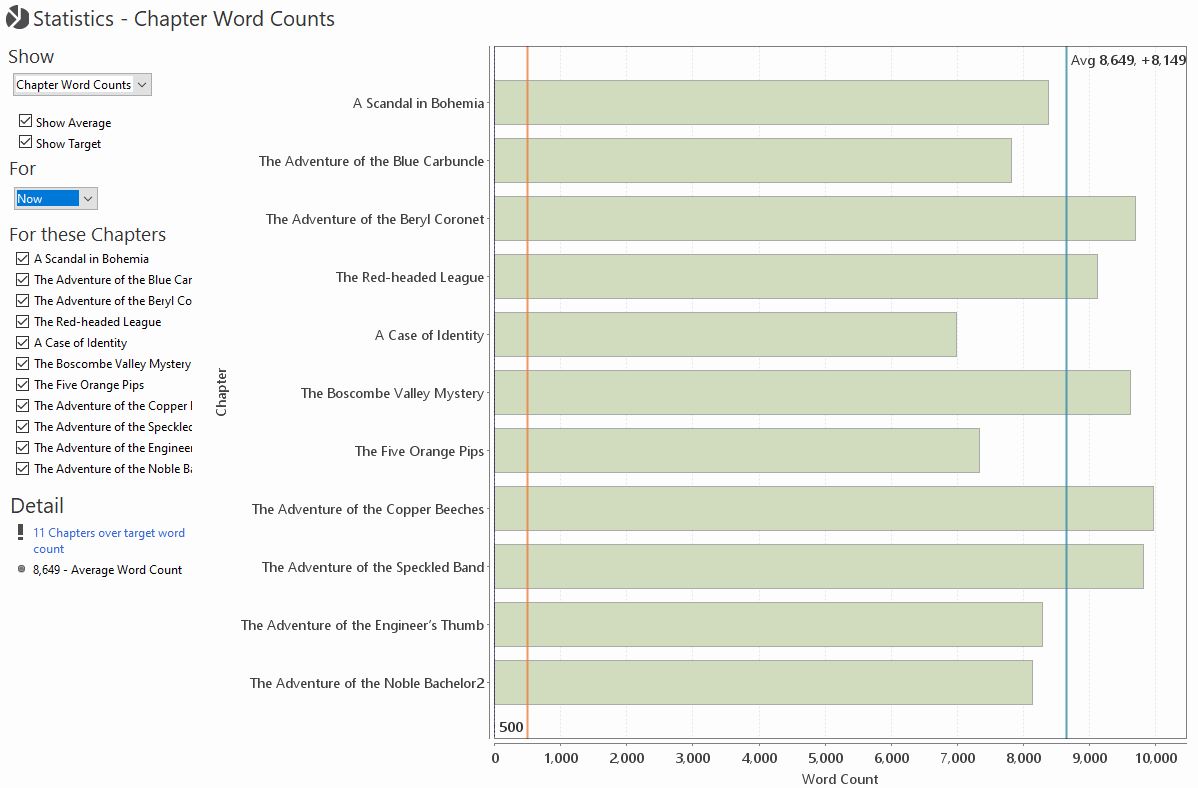
Checking the Show Average checkbox will display a line showing the average word count for each Chapter. If you have a maximum Chapter Word Count Target specified then a Show Target checkbox will be displayed that, when checked, will display a line indicating the word count target. The Detail section will also show a link to display the Chapter that are over the target. Checkboxes next to each Chapter allow you to include or exclude them in the results as desired.
The For drop down list allows you to specify a time period to see how the word counts have changed over time, for instance:
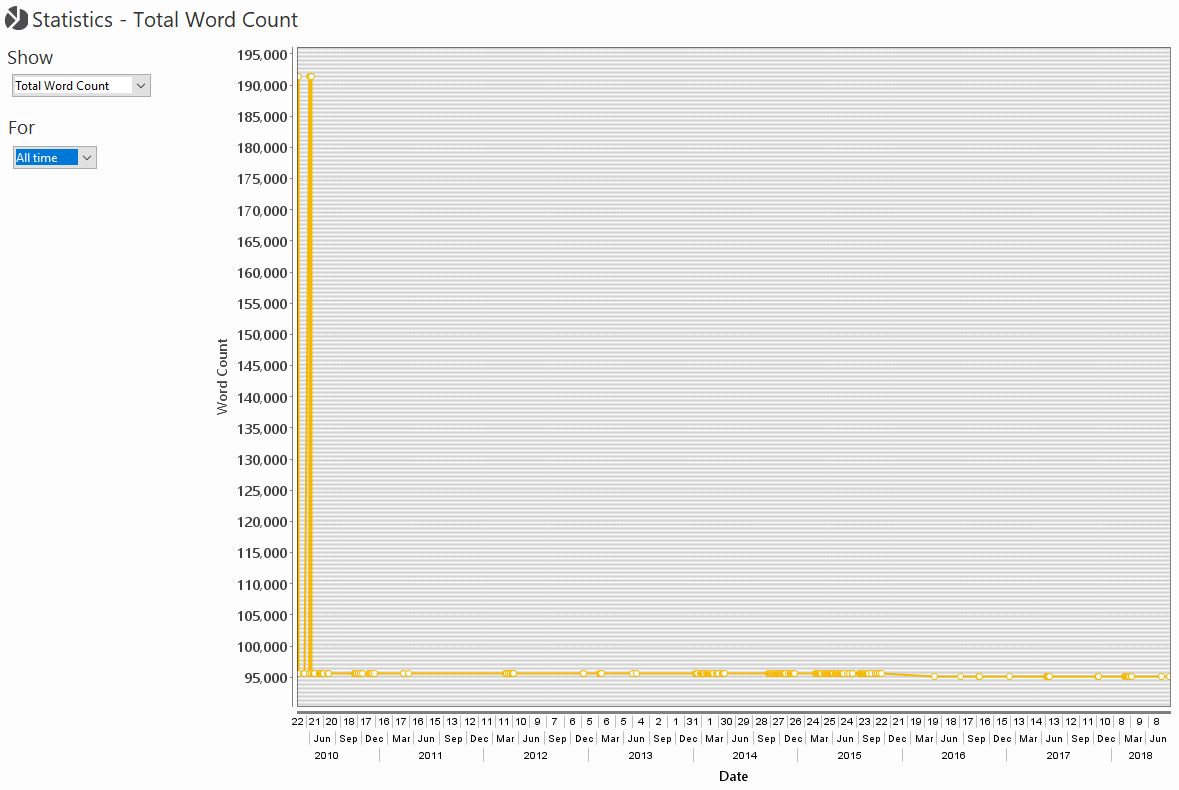
Total Word Count Chart
The Total Word Count chart displays information about the total word counts for Project. An example is shown below:
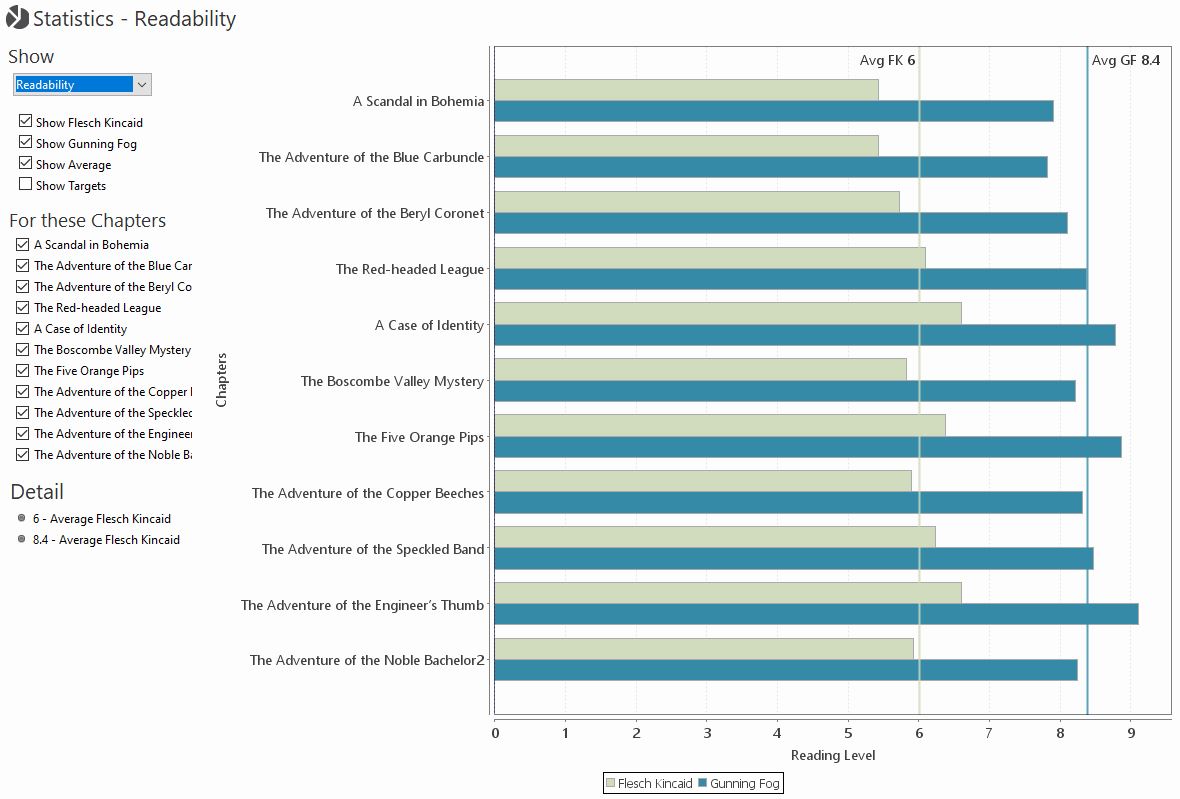
Readability Chart
The following chart displays information about the Readability for a Project.
Session Word Count Chart
The session word count chart displays information about how many words have been written in each writing session.
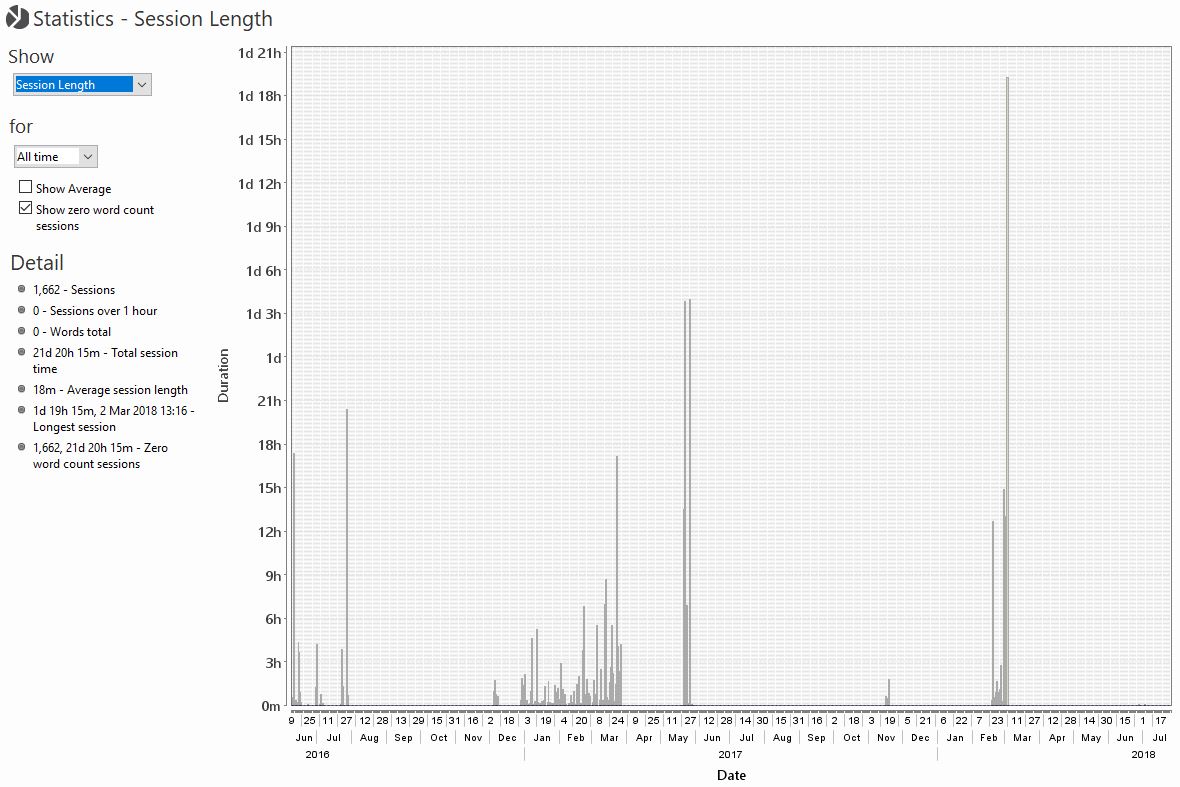
Session Length Chart
The session length chart displays information about the amount of time spent in each Quoll Writer session. The Detail section more statistics about session length, averages and word counts related to the sessions.